The FedExCup finale brings the 30 best players of the season to East Lake, and PropGolf captures TrackMan-style radar on every shot they hit: ball speed, launch, spin, and apex height. Here is what the tee-shot data says about the field's raw power through three rounds.
Want to see what these numbers do for a player you care about? The scenario engine re-simulates a full round with the figures below as knobs you can drag. Open the scenario engine, free and no account needed.
Tee-shot ball speed leaders
| Rank | Player | Avg ball speed | Peak ball speed | Apex |
|---|---|---|---|---|
| 1 | Chris Gotterup | 180.6 mph | 188.8 | 104 ft |
| 2 | Xander Schauffele | 179.5 mph | 188.7 | 112 ft |
| 3 | Gary Woodland | 179.4 mph | 189.7 | 102 ft |
| 4 | Cameron Young | 179.2 mph | 191.3 | 103 ft |
| 5 | Rory McIlroy | 178.6 mph | 189.8 | 119 ft |
| 6 | Sam Burns | 177.7 mph | 183.5 | 117 ft |
| 7 | Robert MacIntyre | 177.4 mph | 182.3 | 108 ft |
| 8 | Scottie Scheffler | 177.1 mph | 183.1 | 120 ft |
Chris Gotterup, one of the longest hitters on the PGA Tour, backs up the billing with the fastest average ball speed in the field at 180.6 mph. Rory McIlroy is the longest driver of the week at 315 yards, and the single hardest-hit drive belongs to Cameron Young at 191 mph.
Who launches it highest
Ball speed is only half the story. Apex height tells you how a player is flighting it, which matters on firm greens where a steeper landing angle holds the surface. The highest tee-shot apex in the field belongs to Alex Fitzpatrick at 125 ft, with Ludvig Aberg right behind at 124 ft. Both trade a little roll for a higher, softer-landing ball.
The bomber profile
The most efficient power pairs high ball speed with low spin. Chris Gotterup does exactly that: 180.6 mph of ball speed at roughly 3,199 rpm of driver spin, the low-spin, high-speed combination that produces maximum carry.
From ball speed to the tee markets
Raw ball speed sets the ceiling on distance, but the markets we price off the tee reward the combination of distance and accuracy. Here is where the field's longest drivers land through three rounds:
| Player | Avg drive | Fairway % |
|---|---|---|
| Rory McIlroy | 315 yds | 58% |
| Ryan Gerard | 309 yds | 63% |
| Gary Woodland | 307 yds | 78% |
| Sam Burns | 305 yds | 59% |
| Xander Schauffele | 305 yds | 58% |
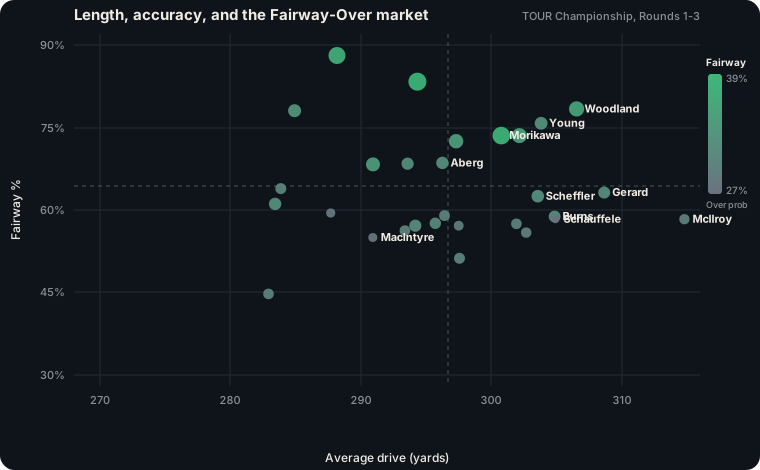
The field averages 297 yards off the tee at 64% fairways. Rory McIlroy is the longest driver at 315 yards, but he finds the short grass 58% of the time. The players who best fit a Fairway Over X yards market are the ones pairing length with control: Gary Woodland leads that group at 307 yards and 78% fairways. In the chart above, the greener and larger a dot, the higher the model's chance that player clears their fairway-distance line, which is why the long-and-accurate names light up and a pure bomber who sprays it stays muted even out at the right edge.
That distance-and-accuracy split is exactly what the model weighs when it prices the off-the-tee markets: drive result (Fairway Over or Under a yardage, or Rough, or Bunker), longest drive, and group fairways.
How we capture this
PropGolf records shot-level radar for every player in the field, every round, not just the featured groups you see on the broadcast. The numbers above are tee shots on par 4s and 5s through Rounds 1 to 3. The same shot data feeds the hole-by-hole model that prices live markets during play.
Want to see the shot-level detail live? See a live preview of the board, or the TOUR Championship tournament page for full hole-by-hole context.
Radar data through Round 3, from PropGolf's live capture.